Briny, Buttery, Summery: “-y” Adjectives in the NYT Cooking Section [OC] Posted by waitingforgoodoh Tags:DataData Is BeautifulDataIsBeautiful 11 comments I made this by getting data through the NYT API (which is excellent; give it a try), and then analyzing it and plotting it in R / ggplot2. You can see the full analysis here! [https://residualthoughts.substack.com/p/greeky-rampy-beans](https://residualthoughts.substack.com/p/greeky-rampy-beans) So basically the cooking section is bigger than it used to be? Having the adjectives above the graphs was … a choice. That choice left me very confused when I got to the last line Mellissa Clark keeping that lemony brightness going Team Brothy is in a rebuilding year. Nothing has declined. Thats the most amazing part. Should have some sort of normalization for total amount of cooking articles. I hate jammy! I also hate the writers at the NYTcooking section This is exactly the kind of useless data I need in my life. They always told me captions go under the chart, and now I understand why What was so lemony in 2019? Leave a ReplyYou must be logged in to post a comment.
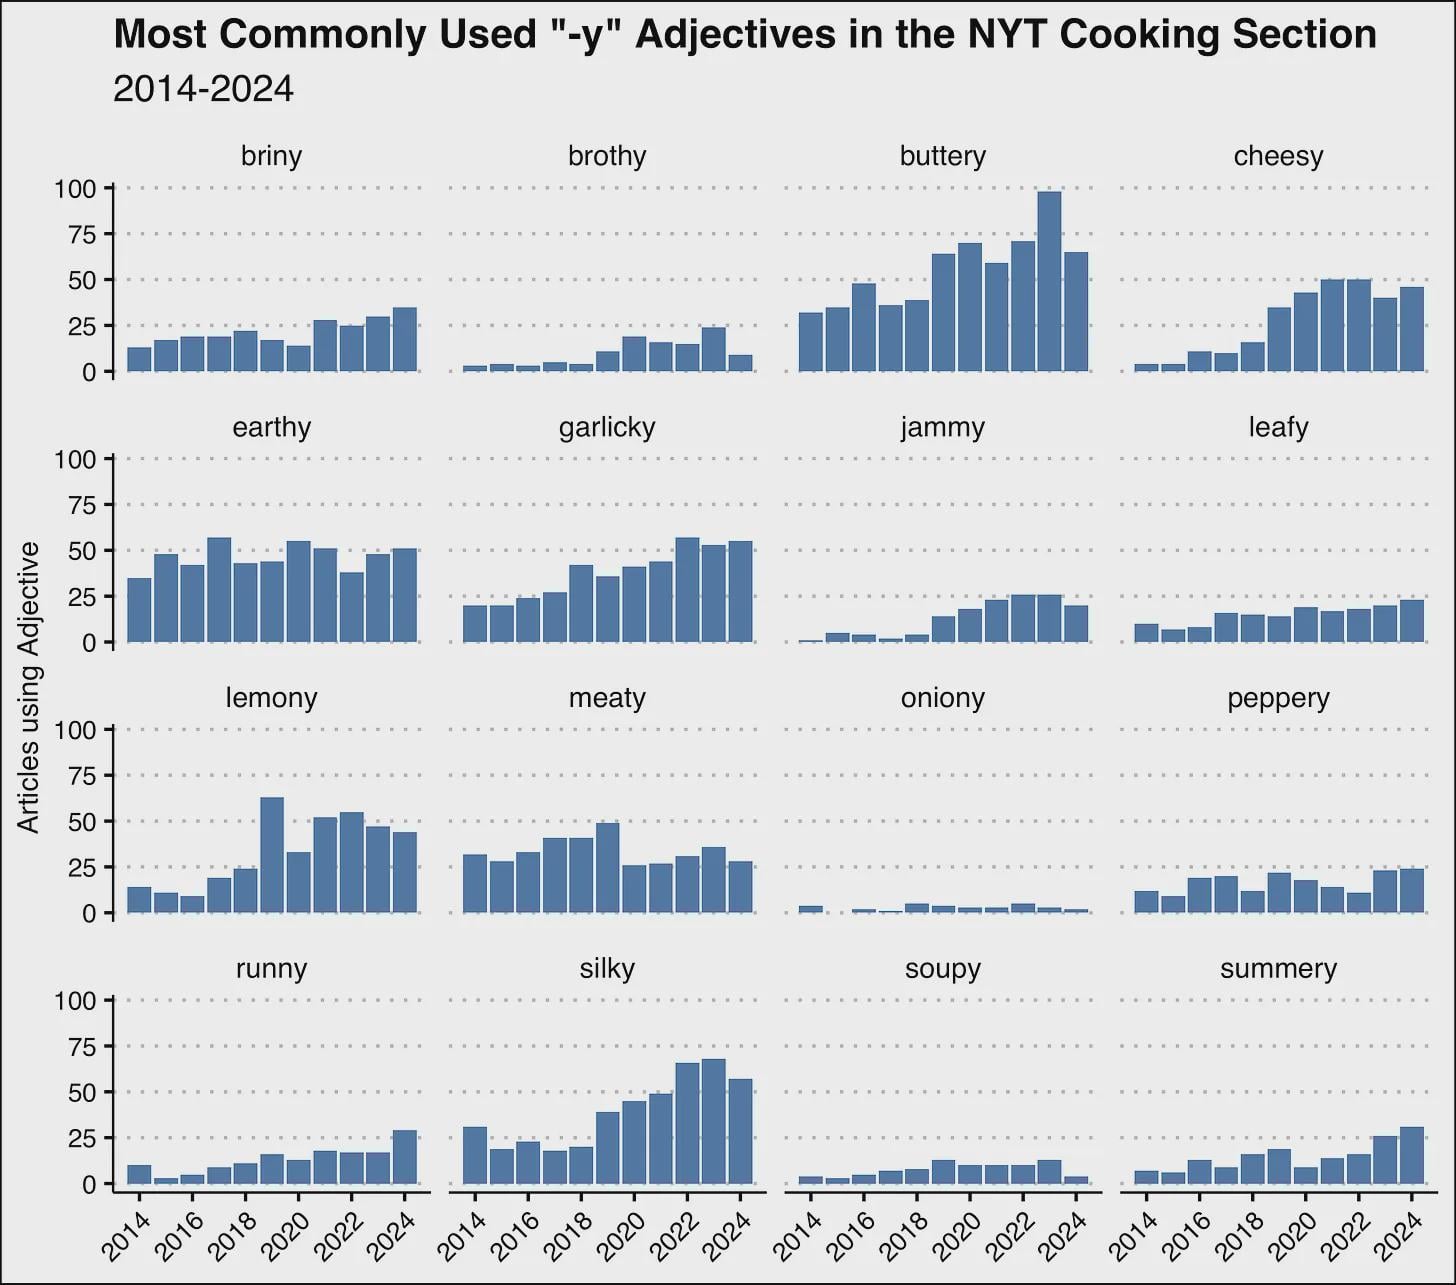
I made this by getting data through the NYT API (which is excellent; give it a try), and then analyzing it and plotting it in R / ggplot2. You can see the full analysis here! [https://residualthoughts.substack.com/p/greeky-rampy-beans](https://residualthoughts.substack.com/p/greeky-rampy-beans)
Having the adjectives above the graphs was … a choice. That choice left me very confused when I got to the last line
![Briny, Buttery, Summery: "-y" Adjectives in the NYT Cooking Section [OC]](https://www.europesays.com/wp-content/uploads/2024/09/dofge0pcvsqd1-1456x1024.jpeg)
11 comments
I made this by getting data through the NYT API (which is excellent; give it a try), and then analyzing it and plotting it in R / ggplot2.
You can see the full analysis here! [https://residualthoughts.substack.com/p/greeky-rampy-beans](https://residualthoughts.substack.com/p/greeky-rampy-beans)
So basically the cooking section is bigger than it used to be?
Having the adjectives above the graphs was … a choice. That choice left me very confused when I got to the last line
Mellissa Clark keeping that lemony brightness going
Team Brothy is in a rebuilding year.
Nothing has declined. Thats the most amazing part.
Should have some sort of normalization for total amount of cooking articles.
I hate jammy! I also hate the writers at the NYTcooking section
This is exactly the kind of useless data I need in my life.
They always told me captions go under the chart, and now I understand why
What was so lemony in 2019?