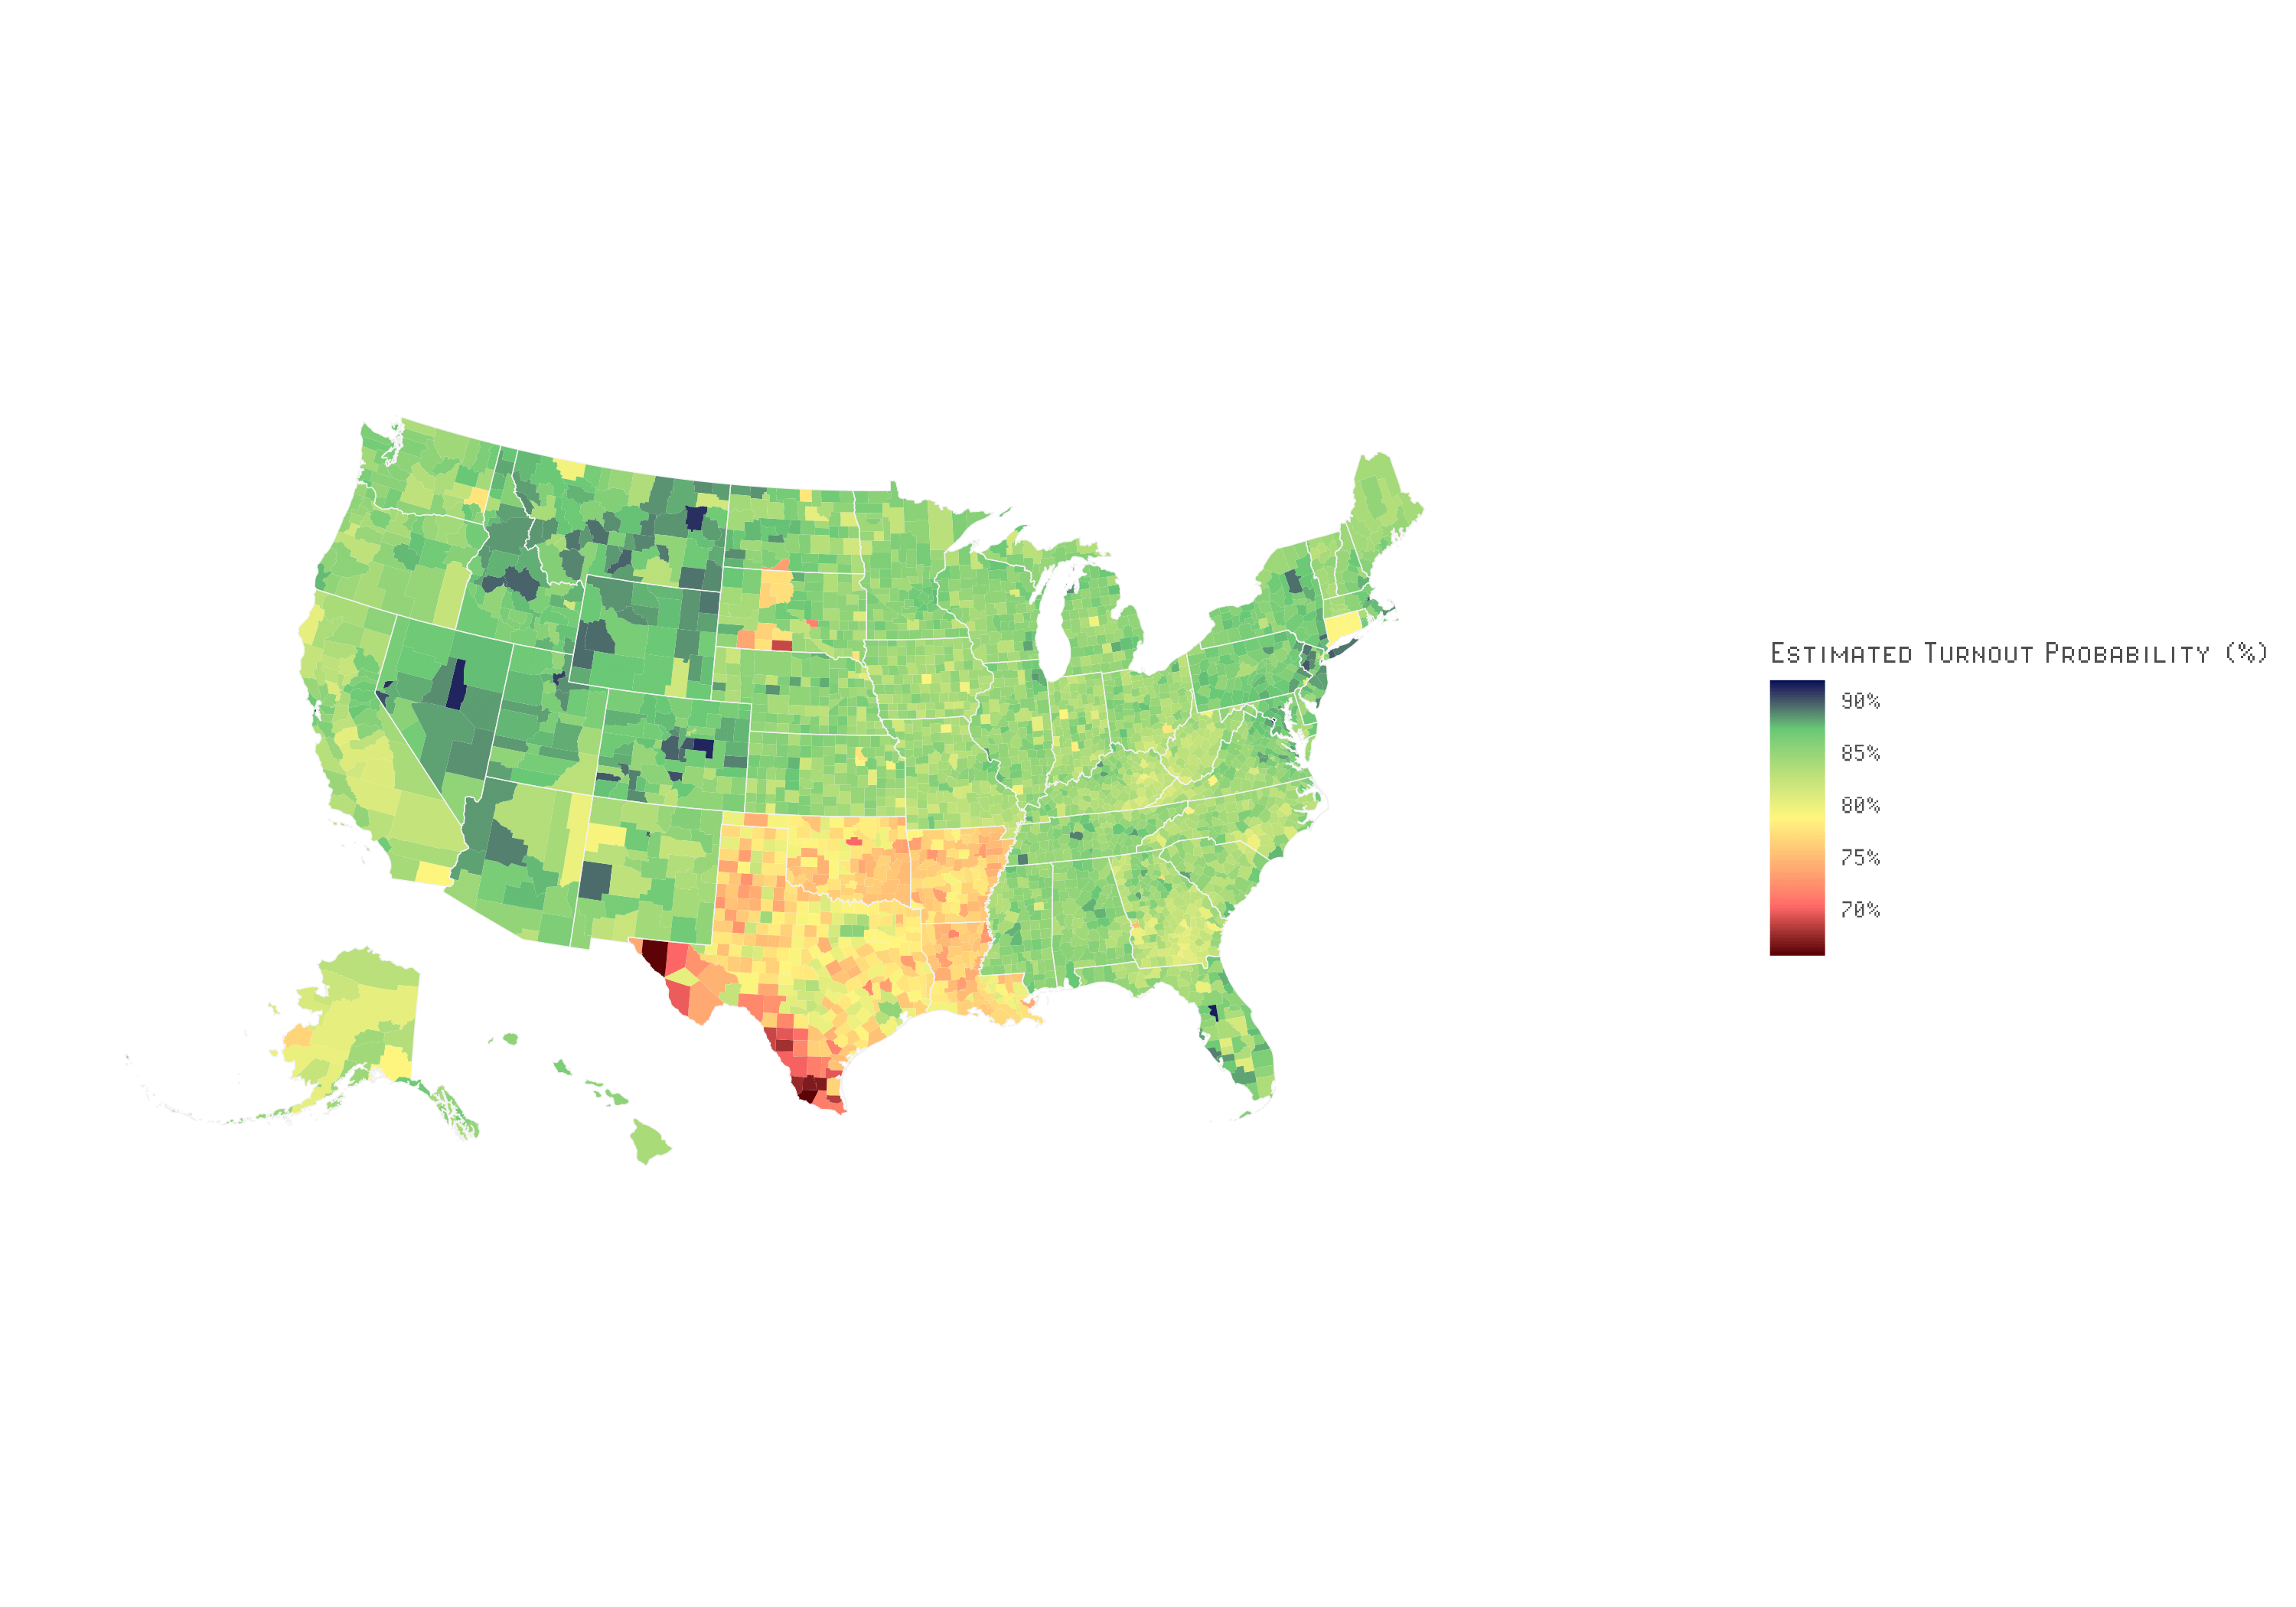
[OC] Estimated Voter Turnout Probability by County for the Upcoming Election (Datagotchi 2024 U.S. Elections, n = 6,228) Using Multilevel Regression and Poststratification
Posted by Lowstack
![[OC] Estimated Voter Turnout Probability by County for the Upcoming Election (Datagotchi 2024 U.S. Elections, n = 6,228) Using Multilevel Regression and Poststratification](https://www.europesays.com/wp-content/uploads/2024/10/4pzuihupcmsd1-1920x1024.png)
[OC] Estimated Voter Turnout Probability by County for the Upcoming Election (Datagotchi 2024 U.S. Elections, n = 6,228) Using Multilevel Regression and Poststratification
Posted by Lowstack
4 comments
Our own survey data collected through [usa.datagotchi.com](http://usa.datagotchi.com)
n = 6228
Tool used: ggplot2
We’re looking at you Texas.
zoom in pls
As a Connecticut resident, I’m curious as to why CT is such an outlier in the Northeast region. Is this a data issue, or is CT voter turnout an actual outlier?