
In the latest quarter, 13 analysts provided ratings for PENN Entertainment PENN, showcasing a mix of bullish and bearish perspectives.
The following table provides a quick overview of their recent ratings, highlighting the changing sentiments over the past 30 days and comparing them to the preceding months.
Bullish
Somewhat Bullish
Indifferent
Somewhat Bearish
Bearish
Total Ratings
4
4
5
0
0
Last 30D
0
1
1
0
0
1M Ago
2
1
1
0
0
2M Ago
0
0
1
0
0
3M Ago
2
2
2
0
0
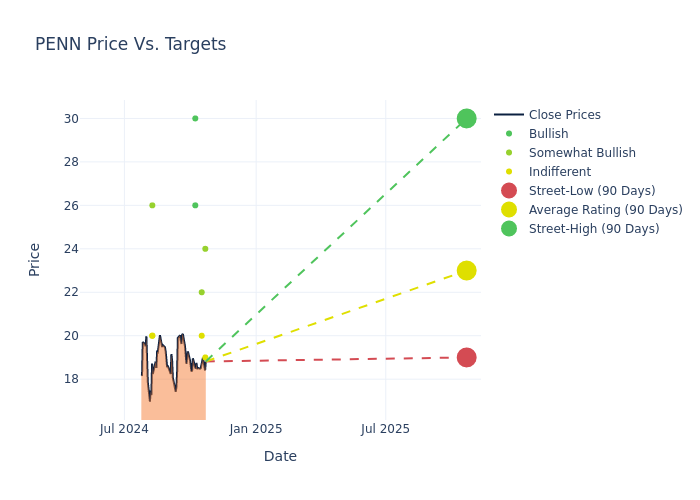
Insights from analysts’ 12-month price targets are revealed, presenting an average target of $23.23, a high estimate of $30.00, and a low estimate of $19.00. This current average has increased by 0.65% from the previous average price target of $23.08.
Diving into Analyst Ratings: An In-Depth Exploration
A clear picture of PENN Entertainment’s perception among financial experts is painted with a thorough analysis of recent analyst actions. The summary below outlines key analysts, their recent evaluations, and adjustments to ratings and price targets.
Analyst
Analyst Firm
Action Taken
Rating
Current Price Target
Prior Price Target
Stephen Grambling
Morgan Stanley
Lowers
Equal-Weight
$19.00
$20.00
Ben Chaiken
Mizuho
Lowers
Outperform
$24.00
$25.00
Daniel Politzer
Wells Fargo
Raises
Equal-Weight
$20.00
$18.00
Brandt Montour
Barclays
Lowers
Overweight
$22.00
$23.00
Ryan Sigdahl
Craig-Hallum
Maintains
Buy
$30.00
$30.00
Bernie McTernan
Needham
Maintains
Buy
$26.00
$26.00
Stephen Grambling
Morgan Stanley
Lowers
Equal-Weight
$20.00
$21.00
Chad Beynon
Macquarie
Maintains
Outperform
$26.00
$26.00
Carlo Santarelli
Deutsche Bank
Raises
Hold
$20.00
$18.00
Brandt Montour
Barclays
Raises
Overweight
$23.00
$22.00
Steven Wieczynski
Stifel
Raises
Hold
$20.00
$19.00
Bernie McTernan
Needham
Maintains
Buy
$26.00
$26.00
Bernie McTernan
Needham
Maintains
Buy
$26.00
$26.00
Key Insights:
Action Taken: Analysts adapt their recommendations to changing market conditions and company performance. Whether they ‘Maintain’, ‘Raise’ or ‘Lower’ their stance, it reflects their response to recent developments related to PENN Entertainment. This information provides a snapshot of how analysts perceive the current state of the company.
Rating: Offering insights into predictions, analysts assign qualitative values, from ‘Outperform’ to ‘Underperform’. These ratings convey expectations for the relative performance of PENN Entertainment compared to the broader market.
Price Targets: Understanding forecasts, analysts offer estimates for PENN Entertainment’s future value. Examining the current and prior targets provides insight into analysts’ changing expectations.
Capture valuable insights into PENN Entertainment’s market standing by understanding these analyst evaluations alongside pertinent financial indicators. Stay informed and make strategic decisions with our Ratings Table.
Stay up to date on PENN Entertainment analyst ratings.
Unveiling the Story Behind PENN Entertainment
Penn Entertainment’s origins date back to its 1972 racetrack opening in Pennsylvania. Today, Penn operates 43 properties across 20 states and 12 brands, including Hollywood Casino and Ameristar. Land-based casinos represented 89% of total sales in 2023; 11% was from the interactive segment, which includes sports, iGaming, and media revenue. The retail portfolio generates mid-30s EBITDAR margins and helps position the company to obtain licenses for the digital wagering markets. Additionally, Penn’s media assets, theScore and ESPN (starting with its partnership launch in November 2023), provide access to sports betting/iGaming technology and clientele, helping it form a leading digital position.
Breaking Down PENN Entertainment’s Financial Performance
Market Capitalization Analysis: Reflecting a smaller scale, the company’s market capitalization is positioned below industry averages. This could be attributed to factors such as growth expectations or operational capacity.
Decline in Revenue: Over the 3 months period, PENN Entertainment faced challenges, resulting in a decline of approximately -0.7% in revenue growth as of 30 June, 2024. This signifies a reduction in the company’s top-line earnings. As compared to competitors, the company encountered difficulties, with a growth rate lower than the average among peers in the Consumer Discretionary sector.
Net Margin: The company’s net margin is below industry benchmarks, signaling potential difficulties in achieving strong profitability. With a net margin of -1.63%, the company may need to address challenges in effective cost control.
Return on Equity (ROE): PENN Entertainment’s ROE lags behind industry averages, suggesting challenges in maximizing returns on equity capital. With an ROE of -0.88%, the company may face hurdles in achieving optimal financial performance.
Return on Assets (ROA): PENN Entertainment’s ROA lags behind industry averages, suggesting challenges in maximizing returns from its assets. With an ROA of -0.17%, the company may face hurdles in achieving optimal financial performance.
Debt Management: PENN Entertainment’s debt-to-equity ratio is below the industry average. With a ratio of 3.73, the company relies less on debt financing, maintaining a healthier balance between debt and equity, which can be viewed positively by investors.
Understanding the Relevance of Analyst Ratings
Within the domain of banking and financial systems, analysts specialize in reporting for specific stocks or defined sectors. Their work involves attending company conference calls and meetings, researching company financial statements, and communicating with insiders to publish “analyst ratings” for stocks. Analysts typically assess and rate each stock once per quarter.
Some analysts will also offer forecasts for metrics like growth estimates, earnings, and revenue to provide further guidance on stocks. Investors who use analyst ratings should note that this specialized advice comes from humans and may be subject to error.
Which Stocks Are Analysts Recommending Now?
Benzinga Edge gives you instant access to all major analyst upgrades, downgrades, and price targets. Sort by accuracy, upside potential, and more. Click here to stay ahead of the market.
This article was generated by Benzinga’s automated content engine and reviewed by an editor.
© 2024 Benzinga.com. Benzinga does not provide investment advice. All rights reserved.