We recruited 606 patients according to our sampling plan on their consent and collected blood samples, which were screened for anti-HCV antibodies. The average age of these participant was 32 (32 ± 12) with minimum age of 15 years and maximum age of 71 years. Table 1 shows that, among the 606 blood samples, 73 were positive for HCV antibodies, which indicates a 12% seroprevalence of HCV in the District Nowshera, KP, Pakistan (Fig. 1). This is consistent with the findings of Ali, et al.,17 which reported seroprevalence rate among high-risk groups as 15.57% in Khyber Pakhtunkwha, Pakistan. 332 (54.8%) males and 274 (45.2%) females participated in the survey, among whom, 15.4% of males and 8.0% of females were seropositive HCV.
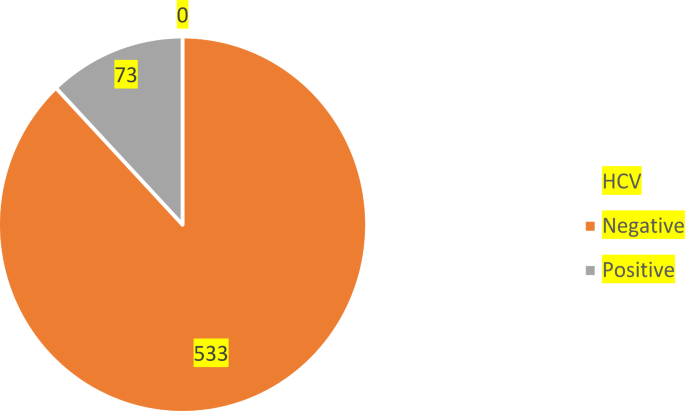
Seroseroprevalence of Hepatitis C virus infection among the studied population.
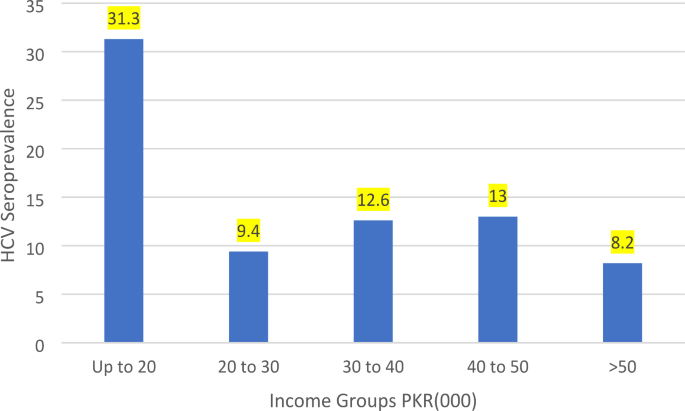
HCV seroprevalence among income level groups.
⁎p
The seroprevalence of HCV is notably elevated in individuals aged 45–54, reaching 29.3%, and is similarly high among those aged 65 and above, at 28.6%. Conversely, the lowest seroprevalence is observed in participants younger than 25 years, at 6.8%. Of the surveyed population, 57 individuals (13.3%) who were unmarried tested positive for anti-HCV antibodies, whereas a lower seroprevalence of 9.0% (16) was observed among their married counterparts. A heightened seroprevalence of 12.8% (55) was observed in households with a residence of medium size families, that is 18–12 individuals. Furthermore, seroprevalence of HCV among uneducated individuals 17.2% (40) was observed. Economic standing undeniably influences the propensity for disease prevention, enabling a sanitary environment and access to preventative resources. Table 1 underscores a higher HCV seroprevalence among communities with diminished economic capacities, noting seroprevalence of 31.3% for monthly household incomes not exceeding PKR20,000 per month (Fig. 2). Detailed demographic characteristics and gender-specific seroprevalence rates are summarized in Table 1.
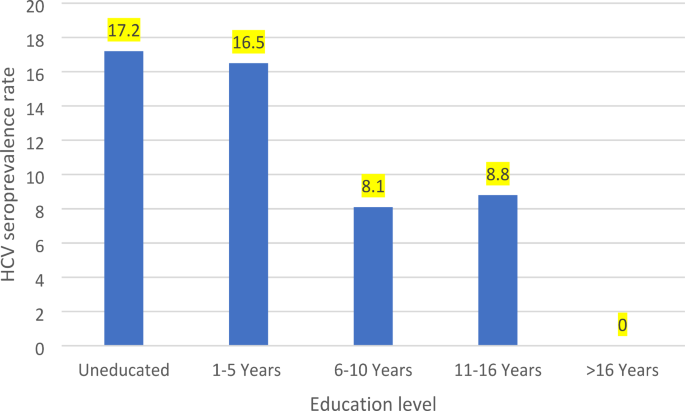
HCV Seroprevalence Across Education Levels.
In Fig. 3, a bar chart depicts the relationship between HCV seroprevalence rates and educational attainment.
⁎p
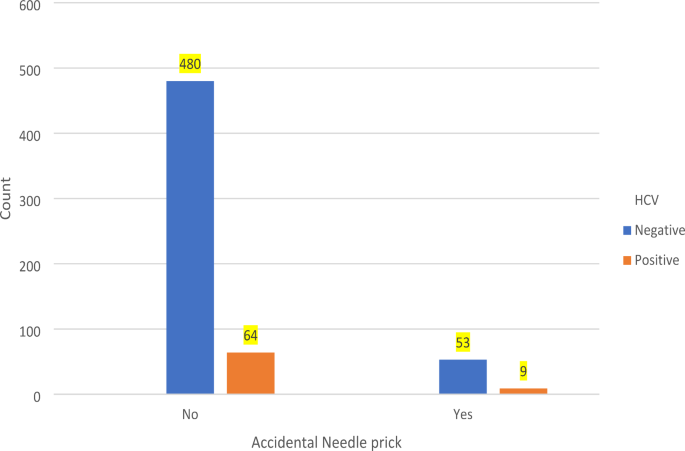
HCV seropositivity among subjects exposed to Accidental needle prick.
Table 2 delineates various clinical risk determinants for HCV transmission. Notably, among Hospitalized, HCV seroprevalence was strikingly high at 19.6%, \(\:{\chi\:}^{2}\)(1, N = 606) = 11.57, p = 0.001), the risk of being infected with exposure to the hospitalized group is 2.09 times more than the counterpart group (RR = 2.09, 95% CI = 1.36, 3.21). This is lower than the HCV seroprevalenc in hospitalized group in Nawabshah, Sindh, Pakistan11. Among those undergoing multiple blood transfusions (at-least one times in the past two years), the HCV high at 21.2% (11 of 52). The chi-square analysis revealed a statistically significant association between blood transfusion and HCV infection, \(\:{\chi\:}^{2}\)(1, N = 606) = 4.53, p = 0.035), indicating that individuals who underwent blood transfusion had an increased risk of HCV (RR = 1.89, 95% CI = 1.06, 3.36). Dental interventions were associated with an HCV seroprevalence of 23.5%, \(\:{\chi\:}^{2}\)(1, N = 606) = 12.305, p = 0.001). This is higher than the 20% seroprevalence of HCV reported in District Peshawar, Pakistan10. Exposure to dental interventions increases the risk of HCV infection by 2.31 times, that is, (RR = 2.31, 95% CI = 1.46, 3.67). Seroprevalence of HCV among surgical patients was 27.8%, which was statistically significant \(\:{\chi\:}^{2}\)(1, N = 606) = 24.68, p = 0.001); individuals prone to surgery are nearly three times more likely to be infected with HCV, (RR = 2.98, 95% CI = 1.94, 4.58). Figure 4 showcases a pictorial presentation of accidental needle prick and HCV cases. The risk ratio of accidental needle prick (RR = 1.23) indicates a modestly increased risk of HCV infection in people exposed to needle prick at health facilities. Furthermore, experiencing tattoo procedures were associated with HCV seroprevalence rates of 14.3%. Concerning the subset frequently subjected to therapeutic injections, our data, as highlighted in Table 2, evidences escalated HCV seroprevalence rates in groups with frequently using injections within both five-years (18.4%), \(\:{\chi\:}^{2}\)(2, N = 606) = 33.39, p = 0.001) and 10-years’ timeframes (17.5%), \(\:{\chi\:}^{2}\)(2, N = 606) = 17.21, p = 0.001).
The seroprevalence of Hepatitis C Virus (HCV) infection was examined in relation to various hygienic risk factors. Notably, the seroprevalence of HCV infection exhibited distinct patterns among individuals engaging in specific practices. Among those who regularly underwent facial shaving by barbers, the observed seroprevalence of HCV infection was notably high at 65.7% (23 of 35), the association between facial shaving at barber and HCV status is highly statistically significant \(\:{\chi\:}^{2}\)(2, N = 606) = 136.9, p 0.001). A similar trend was observed among individuals who sought ear or/and nose piercing services, with a seroprevalence of 15.5%, \(\:{\chi\:}^{2}\)(1, N = 606) = 3.361, p = 0.067). Individuals who reported sharing razors at home exhibited a seroprevalence of 15.7%, which means that there is no statistical significance between the HCV status and sharing razor at home \(\:{\chi\:}^{2}\)(1, N = 606) = 1.9, p = 0.167) (Table 3). These observations suggest that HCV seroprevalence is notably higher in the context of barber-related practices compared to other hygiene-related factors.
In the investigation of HCV infection outcomes, we applied a multiple logistic regression model featuring various groupings of demographic, clinical, and lifestyle covariates. The procedure involved stepwise forward selection, and the model chosen, at the ninth iteration, demonstrated the highest value of Cox & Snell R2 and Nagelkerke R2 followed by the lowest value of the Akaike Information Criterion (AIC), which was calculated as 265.06 (Table 4).
The noteworthy risk factors associated with HCV infection are listed in Table 5, which also provides their respective coefficients and key summary statistics of multivariable logistic regression, including slope coefficient, standard error, p-values, adjusted odds ratios (aOR), and confidence intervals for the aOR.
The aOR for workplace-related injuries was determined to be (aOR = 6.69, 95% CI = 3.2, 13.94). This signifies that keeping other factors constant, the likelihood of acquiring HCV infection due to workplace injuries only, is 6.69 times higher than for individuals who have safety measures at their workplace. Likewise, individuals who engage in facial shaving services provided by barbers exhibit an adjusted odds ratio (aOR = 40.6, 95% CI = 13.6, 121). Consequently, the risk of contracting HCV infection is fortified by 40.6 times for those who utilize barber services for shaving compared to those who do not.
Table 5 also highlights the adjusted odds ratio (aOR = 8.6, [CI] 3.03–24.4) associated with a history of use of therapeutic injections frequently. History of HCV-infected family members contributes an aOR = 4.28. This finding indicates that the odds of acquiring HCV infection are 4.28 times greater for individuals living with HCV-infected family members compared to those without any HCV-infected family members. Similarly, other risk factors are interpreted in a comparable manner. Notably, the high-income level group showcases a reduced risk of HCV infection (aOR = 0.03, [C.I] 0.004–0.268), that is, the HCV infection is less likely (by 0.96 times). Specifically, with other covariates held constant, the odds ratio for income level 1 is 0.065, whereas for income level 4, it decreases to 0.03. The likelihood of acquiring HCV infection is 5.01 times higher among individuals who engage in ear and nose piercing practices, as indicated by the adjusted odds ratio. In the multivariable regression analysis, the following factors also showed significant associations with HCV infection: education level upto 16 years education degree ([aOR] 0.173, 95% [C.I] 0.047 − 0.643) which indicates 0.82 times less likely to acquire infection (Table 5).