The Walker circulation is projected to weaken at different tropospheric levels in a warmer future climate (Fig. 1). At the surface, an increase in low SLP over the Indo-Pacific warm pool reduces the east-west SLP gradient (Fig. 1a, b). In the middle and upper troposphere, positive trends over the western Pacific (in regions of climatological ascent) and negative trends over the eastern Pacific (in regions of climatological descent) indicate a weakening of both ascending and descending motions of the Walker circulation (Fig. 1c–f). This weakening is further supported by trends in vertical velocity, with positive values in the western Pacific and negative values in the eastern Pacific (Fig. 1g, h).
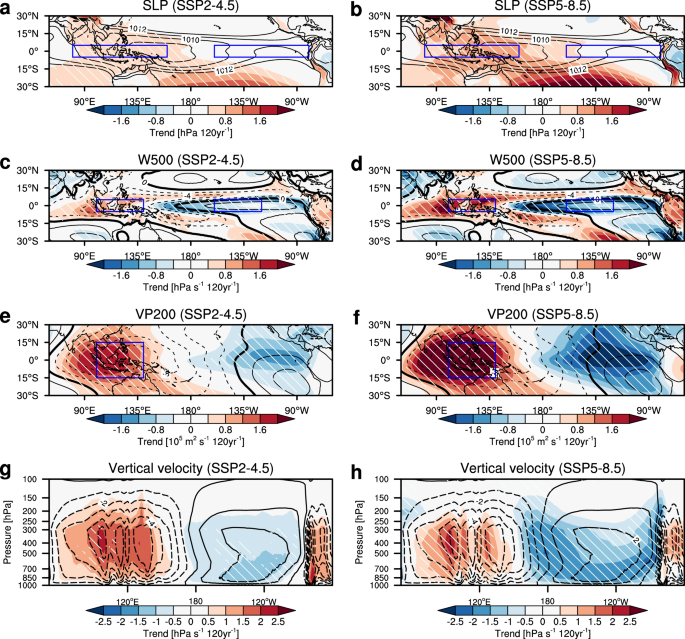
Spatial distribution of linear trends in (a) sea level pressure, (c) vertical velocity at 500 hPa (positive values refer to downward velocity), (e) velocity potential at 200 hPa, and (g) area-averaged vertical velocity over 5°S–5°N under the SSP2-4.5 scenario. Black contours denote the climatological mean from 1980–2014. White slant hatchings denote areas where more than 80% of the models agree in sign of the trends. b, d, f and h are the same as (a), (c), (e), and (g) but under the SSP5-8.5 scenario. Boxes in (a–f) indicate regions used to define the Walker circulation intensity indices and the zonal SST gradient (see Methods).
Almost all models project an overall weakening of the Walker circulation under both medium and high greenhouse gas emission scenarios based on different indices (Supplementary Fig. 1). However, changes in the Walker circulation exhibit remarkably multidecadal variations due to internal variability (Supplementary Fig. 1a, c, and e). After removing the influence of internal variability (see Methods), the externally forced signal shows a weakening trend of Walker circulation at different tropospheric levels in response to global warming (Supplementary Fig. 1b, d, f). This forced weakening happens with enhanced warming in the eastern tropical Pacific (Supplementary Fig. 2c, d) and a greater rise in the tropical mean upper tropospheric temperature (Supplementary Fig. 2e, f).
ToE of the Walker circulation change
The temporal evolution of signal-to-noise ratio (see Methods) reveals that the forced Walker circulation change is detected earlier in the middle and upper troposphere than in the lower troposphere (Fig. 2a, c and e). Under the SSP5-8.5 scenario, the multimodel ensemble mean of the forced signal is likely to exceed the range of internal variability in 2040s in the dW500 index (middle troposphere) and 2050s in the VPmax index (upper troposphere) (Fig. 2c and e), while it will not emerge until the 2080s in the dSLP index (lower troposphere) (Fig. 2a). The forced weakening of Walker circulation under the SSP2-4.5 scenario shows similar results, but with a delayed emergence period across all tropospheric levels (Fig. 2a, c and e). Moreover, there is a spread in the signal-to-noise ratio across models, gradually increasing over time (Fig. 2a, c, and e). This increased intermodel spread is explained by the increased intermodel uncertainty in the forced signal of the Walker circulation change (Supplementary Fig. 1b, d, and f).
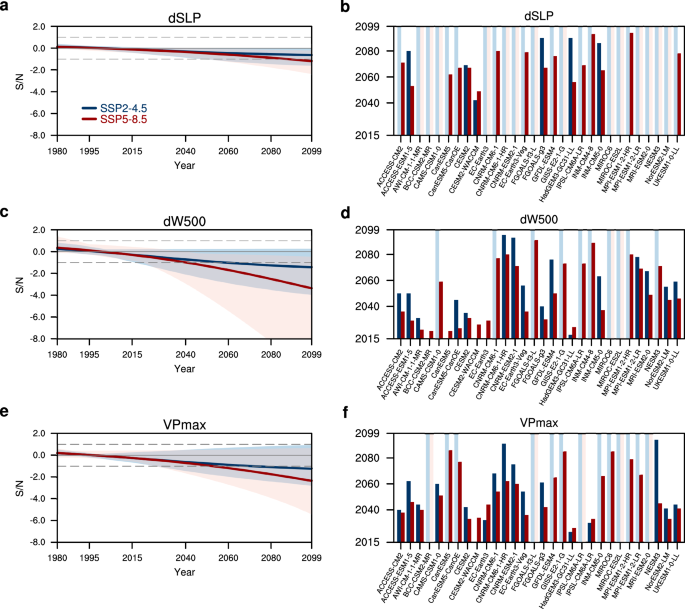
a Signal-to-noise ratio of the Walker circulation intensity change relative to the 1980–2014 baseline calculated based on the sea-level pressure gradient (dSLP). Blue (red) thick line denotes the ensemble mean of models under the SSP2-4.5 (SSP5-8.5) scenario, while blue (red) shading indicates the model spread. The gray dashed lines denote the signal-to-noise ratio of 1 or -1. b Time of emergence (ToE) for annual-mean Walker circulation intensity change based on the dSLP index, under the SSP2-4.5 (blue bars) and SSP5-8.5 (red bars) scenarios. Lighter blue and red bars indicate models in which no emergence of the forced Walker circulation intensity change is detected by the end of the 21st century for the respective scenarios. c–f are the same as (a–b) but based on the 500 hPa vertical velocity gradient (dW500) and the maximum absolute value in the 200 hPa velocity potential over the western tropical Pacific (VPmax), respectively.
The ToE analysis (see Methods) further confirms a higher detectability of the Walker circulation weakening in the middle and upper troposphere (Fig. 2b, d, and f). A majority of climate models (93% and 83%) exhibit detectable weakening of the Walker circulation by the end of this century based on the middle and upper tropospheric indices under the SSP5-8.5 scenario (Fig. 2d and f), whereas only approximately half of the models (53%) demonstrate detectability based on the low-level index (Fig. 2b). Furthermore, the ensemble-mean ToE appears earlier in the middle and upper troposphere (year 2050 and year 2053) compared to that at the surface (year 2070) (Supplementary Fig. 3b, d, and f). Earlier emergence of the Walker circulation weakening in the middle-upper troposphere is also found under the SSP2-4.5 scenario, but the ToE is later than that under the SSP5-8.5 scenario in models by several decades (Fig. 2b, d, f).
Factors contributing to early ToE in the middle-upper troposphere
The varying emergence time in the Walker circulation weakening at different tropospheric levels is largely attributed to the distinct signal-to-noise ratio of the Walker circulation change in response to CO2 forcing. The signal of a weaker Walker circulation emerges earliest in the middle troposphere, while it is delayed by about 30 years at the surface (Fig. 3a, c, and e). In the abrupt4×CO2 experiment, the signal-to-noise ratio indicated by the dSLP index is of smaller magnitude compared to that of the dW500 and VPmax indices (Fig. 3a, c, and e). This lower signal-to-noise ratio for the dSLP index results in a longer time required for the signal to exceed the noise range. Consequently, the signal in the dSLP index does not surpass the noise until about 30 years later, whereas in the dW500 and VPmax indices, the signal of a weaker Walker circulation emerges much earlier (Fig. 3a, c, and e).
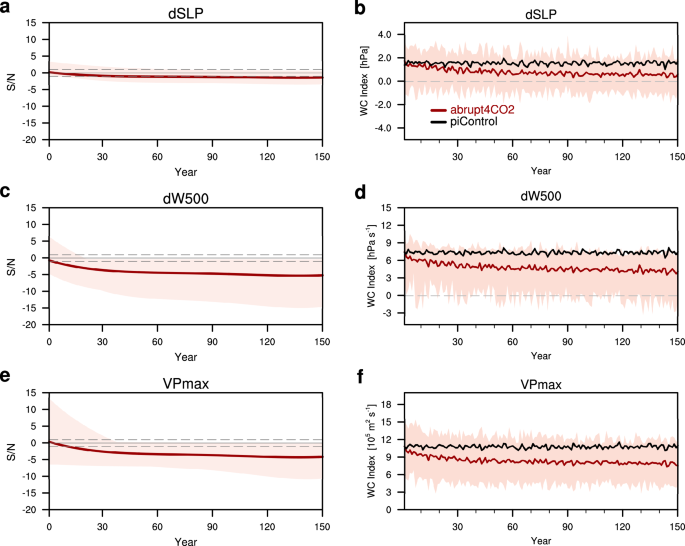
a, c and e Time series of the signal-to-noise ratio of the Walker circulation change in the abrupt4×CO2 experiment based on the sea-level pressure gradient (dSLP), the 500 hPa vertical velocity gradient (dW500), and the maximum absolute value in the 200 hPa velocity potential (VPmax), respectively. b, d and f Time series of the Walker circulation intensity in the pre-industrial control experiment (black line) and the abrupt4×CO2 experiment (red line) based on dSLP, dW500, and VPmax indices, respectively. Red shading indicates the model spread in the abrupt4×CO2 experiment.
The spatial distribution differences in both signal magnitude and internal variability explain the variation in emergence times among the indices. At the surface, the SLP signal only emerges in the western tropical Pacific in the first 10 years of the abrupt4×CO2 experiment (Fig. 4a). This is because the SLP strengthens over the western tropical Pacific in response to increased CO2 forcing in the first few years, with no significant change seen in the eastern tropical Indian Ocean and eastern tropical Pacific (Supplementary Fig. 4a). However, the internal variability in the latter regions is higher than that in the western tropical Pacific (Supplementary Fig. 4b). Consequently, the signal-to-noise ratio peaks in the western tropical Pacific. Therefore, the difference between the east and the west over the tropical Pacific yields a low signal-to-noise ratio in the dSLP index. In contrast, the dW500 index emerges earliest due to a stronger signal in the Maritime Continent region and the central tropical Pacific, coupled with lower internal variability in these areas (Fig. 4c, d and Supplementary Fig. 4c, d).

a–b Spatial distribution of the signal-to-noise ratio of sea level pressure (SLP) for the first 10 years and the last 50 years. Shown are the multimodel ensemble mean. White slant hatchings denote areas where more than 80% of the models agree on the sign of changes. c–f are the same as (a–b) but for vertical velocity at 500 hPa (W500) and velocity potential at 200 hPa (VP200), respectively. Boxes indicate regions used to define the Walker circulation intensity indices.
The stronger signal in the middle-upper troposphere is related to a larger fast weakening response in the middle-upper component of the Walker circulation in response to CO2 forcing. The temporal evolution of the Walker circulation response in all indices from the abrupt4×CO2 experiment shows two different stages: a fast response, which refers to the response in the first few years to the abruptly imposed CO2, and a slow response, which is characterized by a longer-term adjustment (Fig. 3b, d, and f). The slow responses in all three indices display a pronounced weakening of the Walker circulation, which stabilizes after about 100 years (Fig. 3b, d, and f). However, the fast response in the surface differs from that in the middle-upper troposphere. At the surface, the weakening of the Walker circulation becomes significant after 20–30 years, while in the middle-upper troposphere, the Walker circulation weakens from the initial stage (Fig. 3b, d, and f).
The larger fast weakening of the middle and upper Walker circulation is caused by stronger radiative forcing, enhanced static stability, and slower radiative cooling in the middle and upper troposphere compared to the surface. The increased atmospheric CO2 concentration reduces infrared radiation loss more in the upper troposphere than at the surface, leading to faster warming and greater static stability at higher altitudes31,36,37. This enhanced stability weakens the middle and upper Walker circulation, as the upper troposphere stabilizes more rapidly than the lower layers36,37. As the entire troposphere warms, the moist adiabatic lapse rate disproportionately increases static stability in the upper troposphere, further suppressing buoyancy-driven motions that support the Walker circulation36,38,39,40. Additionally, CO2-driven warming slows the rate of radiative cooling31,37,38,39, weakening vertical motions in the middle and upper troposphere, leading to a significant weakening of the Walker circulation at these levels37,39. In contrast, the circulation changes near the surface are primarily influenced by boundary layer processes and surface fluxes, which are closely tied to SST changes. Hence, when the zonal SST gradient begins to decrease after about 30 years, the SLP also starts to change (Supplementary Fig. 5). The above results suggest that the mid-to-upper-level component of the Walker circulation weakens directly in response to increased atmospheric CO2 radiative forcing36, while the weakening of its surface manifestation is delayed by SST adjustment processes related to ocean dynamics. Therefore, the forced signal in Walker circulation change indicated by indices from the middle and upper troposphere is more likely to be detected earlier than the lower tropospheric indices.
Sources of intermodel uncertainty in ToE
A large spread exists in the ToE across different models (Fig. 2 and Supplementary Fig. 3). For models exhibiting ToE before 2099, the year of ToE displays a wide-ranging distribution exceeding 50 years (Supplementary Fig. 3). Specifically, the ToE shows a range of 2049–2094 (2042–2090) in the dSLP index, 2021–2091 (2015–2095) in the dW500 index, and 2026–2086 (2015–2094) in the VPmax index under the SSP5-8.5 (SSP2-4.5) scenario (Supplementary Fig. 3). Notably, certain models even indicate the absence of the Walker circulation weakening emergence (Fig. 2b, d and f).
The intermodal uncertainty in ToE likely stems from a wide range of forced signals and internal variability across different models. To analyze the source of intermodel uncertainty in the ToE, we calculate the ToE by simultaneously considering the forced signal and internal variability in all the models based on three indices (Fig. 5a, c, and e). Here we estimate the magnitude of the forced signal as the long-term trend of the forced Walker circulation change. The results show that the ToE is influenced by both internal variability and the forced signal, with an earlier ToE appearing when there is smaller internal variability and a larger forced signal (Fig. 5a, c, e and Supplementary Fig. 6a, c and e). Since the Walker circulation responds to CO2 forcing with both a fast and slow response, we examine the intermodel relationships between ToE and the fast response (Supplementary Fig. 7), ToE and the slow response (Fig. 5b, d, f and Supplementary Fig. 6b, d and f), and ToE and internal variability (Supplementary Fig. 8). The highest intermodel correlation coefficient between the ToE and the slow response suggests the major role of slow response in explaining the intermodel difference of ToE (Fig. 5b, d, f, and Supplementary Fig. 6b, d and f). The stronger the slow response is, the earlier the ToE appears, and vice versa. For models showing Walker circulation weakening but no emergence (Fig. 2b, d, f), this can be attributed to a smaller slow response rather than larger internal variability (Fig. 5 and Supplementary Fig. 8).
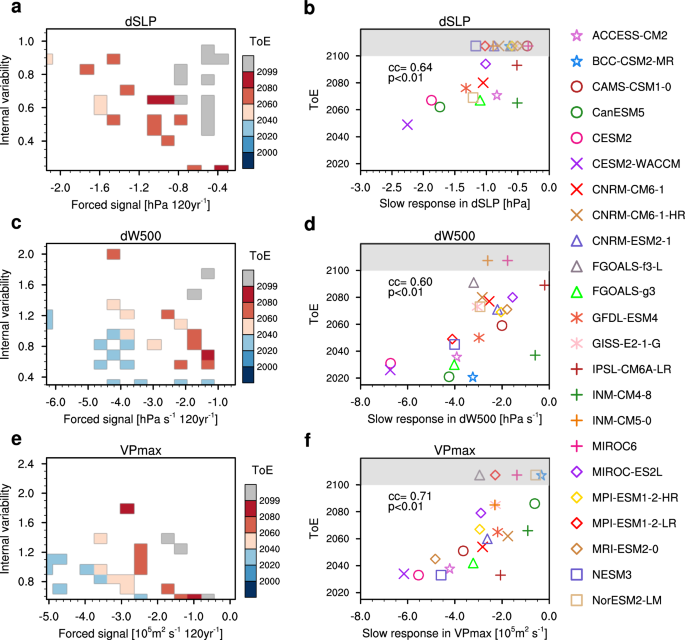
a Likely range of time of emergence (ToE) determined by forced signal (x-axis) and internal variability (y-axis) based on sea-level pressure gradient (dSLP) in CMIP6 models under the SSP5-8.5 scenario. b Intermodel relationship between ToE and slow response of the Walker circulation (See Methods) in the abrupt4×CO2 experiment based on the dSLP index. The intermodel correlation coefficient and p-value are shown in the upper-left corner of the panels, with p c–f are the same as (a–b) but for the 500 hPa vertical velocity gradient (dW500) and the maximum absolute value in the 200-hPa velocity potential over the western tropical Pacific (VPmax), respectively. Gray shading in (b), (d) and (f) indicates models without ToE.
The slow response of the Walker circulation change is mainly determined by zonal SST gradient change (Supplementary Fig. 9), which is modulated by an ocean thermostat response. We select two subsets of models, namely Group-E (models with an earlier ToE) and Group-L (models with a later ToE), based on the occurrence time of the ToE to verify the influence of the ocean thermostat mechanism (Table S1) (see Methods). Models in Group-E show earlier ToE in all three indices while ToE in Group-L models arises later. In Group-L models, the initial SST change over the first 10 years resembles the ocean thermostat response, displaying negative SST anomalies in the central equatorial Pacific (Fig. 6a). It shows that an enhanced upwelling of cold water acts as a balancing mechanism to counter the radiative forcing caused by increased CO233,34,35. The cooling or suppressed warming pattern eventually shifts to an enhanced eastern equatorial Pacific warming (Fig. 6b). In Group-E models, however, immediate warming over the eastern equatorial Pacific occurs, which progressively intensifies over time (Fig. 6c, d). The results above suggest that the ocean thermostat delays the weakening of the zonal SST gradient. The transition from cooling to warming SST pattern in Group-L models delays the weakening of the Walker circulation, thus postponing the emergence of a weaker Walker circulation. However, the enhanced extratropical warming and weakened subtropical oceanic cells diminish the supply of cold water to equatorial upwelling after a longer-term of adjustment in both groups of models, resulting in a reduced zonal SST gradient30. Therefore, the difference in the magnitude of the slow response in the zonal SST gradient across models leads to intermodel uncertainty in the slow response of the Walker circulation to CO2 forcing, and consequently, in the ToE.
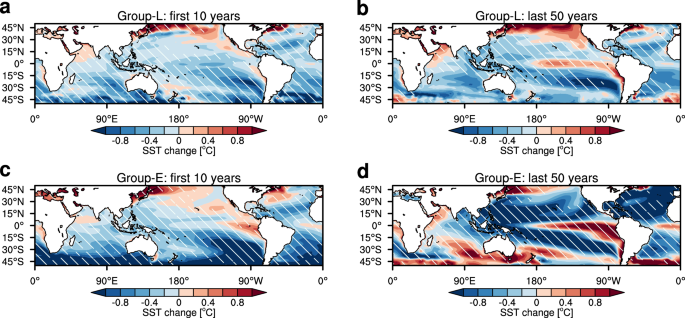
a Initial and (b) long-term sea surface temperature (SST) anomaly patterns in the abrupt4×CO2 experiments for Group-L models. c–d The same as (a–b) but for Group-E models. The SST anomalies are derived by comparing them to the piControl experiments and then subtracting the average ocean warming within the 40°S–40°N, 60°E–60°W region. Shown are the ensemble mean. White slant hatchings denote areas where all the models agree in sign.