. DOI: 10.1038/s41593-024-01783-4")
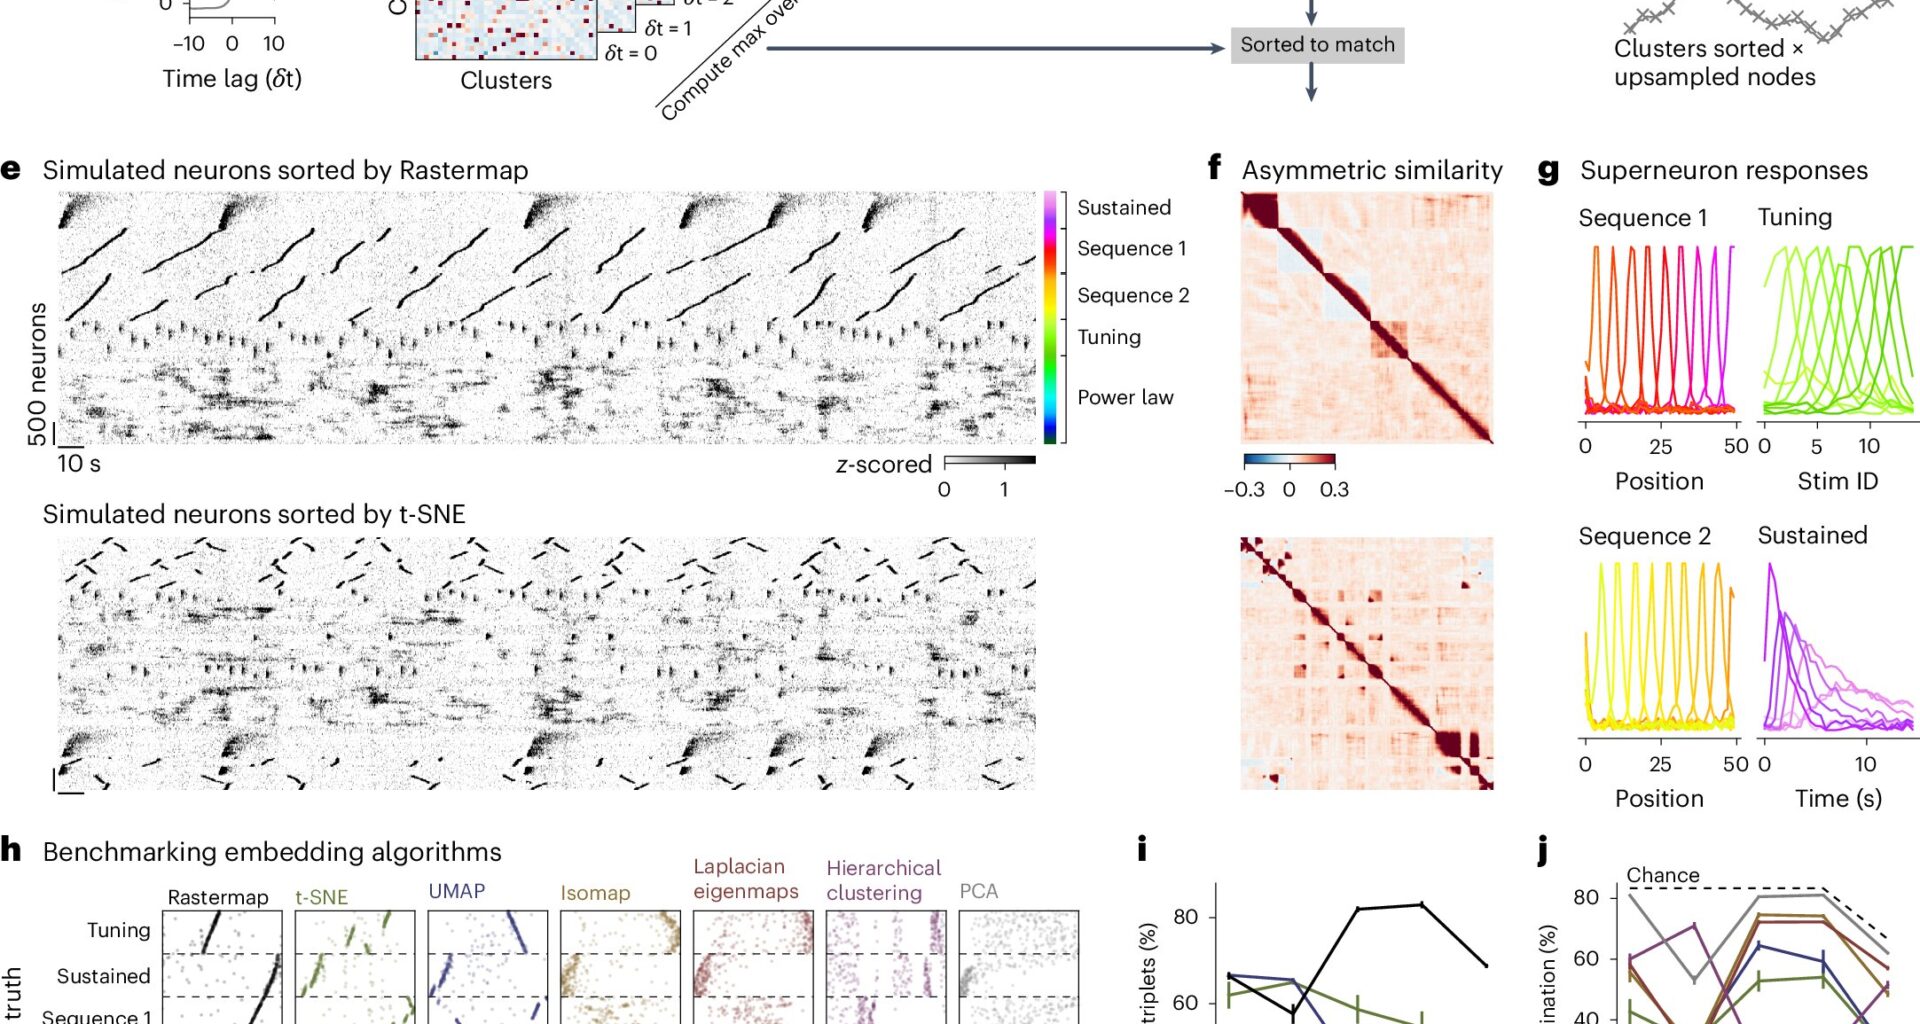
Benchmarking Rastermap on simulated data with multiplexed neural activity. Credit: Nature Neuroscience (2024). DOI: 10.1038/s41593-024-01783-4
Neuroscientists have learned a lot—like which neurons and circuits are associated with different behaviors—by recording the activity of small sets of neurons.
But what happens when you record thousands of neurons at one time? Or when you want to figure out the role of neurons when there isn’t an obvious external catalyst or you’re not sure what you’re even looking for?
That’s where Rastermap comes in.
The new visualization tool developed by the Stringer and Pachitariu labs at HHMI’s Janelia Research Campus helps scientists uncover activity patterns in large-scale neural recordings—the first step in the development of new theories about how individual neurons and circuits enable behavior.
The work is published in the journal Nature Neuroscience.
“If you want to explore your data, you need to visualize it,” says Janelia Group Leader Carsen Stringer. “There are things you wouldn’t necessarily think of that could be in that data, so you want to visualize it in a way to generate new hypotheses that you haven’t thought of before.”
Rastermap is an algorithm to sort the activity of thousands of neurons into clusters based on how similar their activity is, even if they are firing at different times or their activities don’t match up with an observable behavior. The clusters are then mapped onto a raster plot, a graphical representation of the spikes over time, which allows researchers to visualize and identify patterns in the data that can then be further tested in the lab.
Unlike previous visualization tools, which use an average of the neuronal activity observed during many experimental trials to find patterns, Rastermap enables researchers to visualize neuronal activity from a single trial of an experiment. This allows them to see patterns in the data that couldn’t be easily observed with previous methods. Rastermap also lets researchers observe neuronal activity patterns when there’s no external stimulation.
So far, Rastermap, which has an easy-to-use graphical interface, has helped researchers visualize neuronal activity in flies, zebrafish, mice, rats, and primates.
“You can’t ask an animal what they are thinking about, but you can use this unsupervised technique to discover potentially new things in your data that are related to the cognitive processes going on in the animal,” Stringer says. Even if the activity is related to an external factor, “Rastermap helps you visualize it in a clearer way.”
More information:
Carsen Stringer et al, Rastermap: a discovery method for neural population recordings, Nature Neuroscience (2024). DOI: 10.1038/s41593-024-01783-4
Citation:
Visualization tool helps scientists spot neuronal activity patterns in mountains of data (2024, October 24)
retrieved 25 October 2024
from https://medicalxpress.com/news/2024-10-visualization-tool-scientists-neuronal-patterns.html
This document is subject to copyright. Apart from any fair dealing for the purpose of private study or research, no
part may be reproduced without the written permission. The content is provided for information purposes only.